Bourlo

Work by Paul Berden.

Main menu

Skip to primary content
Skip to secondary content
  • Home

Post navigation

Newer posts →

Terres – Dutch municipality statistics

Posted on January 9, 2015 by admin

terres

Interactive visualization of all municipalities in the Netherlands, data from the Dutch Central Bureau of Statistics. Based on earlier work and inspired by work from bmcbride. With js help from Tonni and interaction/design help from Bart.

Continue reading →

Posted in Uncategorized

Let’s Make a Dutch Bubble Map

Posted on May 16, 2014 by admin

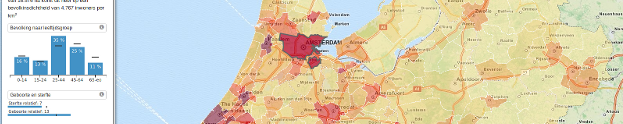
Based on the great tutorial posted by Mike Bostock. A bubble map of the Netherlands with its population displayed per municipality. Continue reading →

Posted in Uncategorized

Gemeente Venlo Mapp

Posted on July 8, 2013 by admin

Map of gemeente Venlo

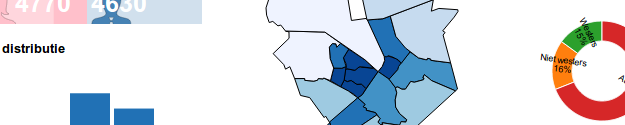
Visualization of a municipality in the Netherlands, based on data from the Dutch Central Bureau of Statistics.

Posted in Uncategorized

Show Me the Numbers

Posted on June 13, 2013 by admin

Show Me the Numbers

Continue reading →

Posted in Uncategorized

Force

Posted on June 6, 2013 by admin

force

Posted in Uncategorized

D3.js

Posted on June 6, 2013 by admin

http://d3js.org/

Posted in Uncategorized

Post navigation

Newer posts →

Test

Yolo

Recent Posts

  • Horse Checker built with Covalent
  • Revenue analysis with dc.js
  • Datatables implementation
  • Walk around Rotterdam
  • Editable Force Network

Recent Comments

    Archives

    • January 2017
    • July 2016
    • May 2016
    • April 2016
    • March 2016
    • January 2016
    • March 2015
    • January 2015
    • May 2014
    • July 2013
    • June 2013

    Categories

    • Uncategorized

    Meta

    • Log in
    • Entries RSS
    • Comments RSS
    • WordPress.org
    Proudly powered by WordPress